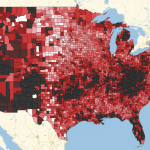
This map is a spectacular example of how data reshape public perception and knowledge. Very simple in nature it nevertheless shocks an average citizen by giving clarity to the data usually buried in obscure tables. East versus west, federal versus private, – the contrast is sharp and reverberates in the minds entangled with American history. […]
Posts Tagged: Mathematica
Computational history: countries that are gone
X – country birth | Y – country death | RADIUS – lifetime Mongol Empire The Mongol Empire existed during the 13th and 14th centuries and was the largest contiguous land empire in history. Originating in the steppes of Central Asia, the Mongol Empire eventually stretched from Eastern Europe to the Sea of Japan, extending […]
Evolution of topics in Romeo & Juliet
The actual APP that does some analysis of Shakespeare’s “Romeo and Juliet” is located HERE. Please wait through a potential little load or evaluation times, it is computing! Read below for the explanation of how app works and other ideas on Shakespeare’s data mining. April 23, 2016 marks 400th anniversary of Shakespeare’s death. Just a […]
Interactive 3D Barth Sextic Surface
“The Barth-sextic is a sextic surface in complex three-dimensional projective space having the maximum possible number of ordinary double points, namely 65. The surface was discovered by Wolf Barth in 1994, and is given by the implicit equation: where phi is the golden ratio.” ~ MathWorld. We can write short Wolfram Language code ( by […]
Interactive 3D Calabi-Yau Surface
Wolfram Language allows creation of computational 3D models. These are different from those you can build with your own hands such as SketchUp etc, because computations are often intrinsically different from the way humans see and think. Let’s take for example Calabi-Yau Surface. It is a mathematical object and it is hard to imagine it. […]
Drug overdose trends in USA counties 1999 – 2014
The data Drug Poisoning Mortality: United States, 1999–2014 are published by USA government. In a few recent blogs (1, 2, 3) static visualizations of data were performed. Here we show how to animate maps of geographical drug overdose spread in USA. Below you can see 4 images, each reflecting upon Age-adjusted death rates for drug […]
On design of styles for small weighted graphs
I sometimes get asked what is the best way to style edges and vertices with different numerical values, like weights or centrality measures, for example. In this post i will go over small graphs, because large graphs are a very different story and require a different, sometimes opposite approach. A network is a messy creature, […]
Find Waldo Faster
Read my new article published by Wolfram Blog: Find Waldo Faster. Here are some images from the article.
Modeling a Pandemic like Ebola
Please read my new blog post published by Wolfram Research: Modeling a Pandemic like Ebola with the Wolfram Language Click here for a Russian translation.
Happy ASCII New Year ;-)
I can occasionally appreciate a nice ASCII art design. But the better is the design, the more manual and custom approach it needs – or so it seems. It is actually quite challenging, if you think about it, to transform a known image or shape to a limited medium using finite set of geometries. So […]
t * sin (t) = Christmas tree
Another code sample from Wolfram Community. I noticed that a discussion about programming a lighted Christmas Tree from a simple equation t*Snt[t] became very popular on Reddit. It is connected to a project a programmer developed. I thought how fast we can make it with Wolfram language? Here is the result with slight flickering 😉 […]
Dancing with friends and enemies: swarm intelligence
This post is based on a thread from Wolfram Community. The rules by Simon Woods are simple: 1000 dancers assume random positions on the dance-floor. Each randomly chooses one “friend” and one “enemy”. At each step every dancer moves 0.5% closer to the centre of the floor, then takes a large step towards their friend […]
Iconography for Elementary Cellular Automata Based on Radial Convergence Diagrams
My recent publication at the Wolfram Demonstrations Project: “Iconography for Elementary Cellular Automata Based on Radial Convergence Diagrams“. Consider a complete set of initial conditions for a finite elementary cellular automaton (ECA). This set can be indexed by integers using a Gray code or a binary to decimal conversion. During the ECA evolution, the […]
Order, Chaos, and the Formation of a Cantor Set Attractor in Elementary Cellular Automata
My recent publication at the Wolfram Demonstrations Project: Order, Chaos, and the Formation of a Cantor Set Attractor in Elementary Cellular Automata Consider finite elementary cellular automata (ECA) of size 10. All possible binary vectors of length 10 form a complete set of initial conditions (CSIC). Every step of an ECA evolution maps this set to […]
Time Series and Cobwebs for Arbitrary Recursive Maps on the Unit Interval
My new publication at the Wolfram Demonstration Project is Time Series and Cobwebs for Arbitrary Recursive Maps on the Unit Interval. Follow the link to view interactive version. Here is an exert from text: “The logistic map is probably the most famous and simplest example of a function from the unit interval onto itself that […]
Complex numbers, beautiful surfaces and Mathematica
A few lines of code in Mathematica can produce beautiful images. Take as an example this simple but spectacular result of singularities in complex plane: Plot3D[Im[Sec[(x + I y)^4]], {x, -2, 2}, {y, -2, 2}, Mesh -> None, ClippingStyle -> None, PlotStyle -> Directive[Orange, Opacity[.8], Specularity[White, 20]], PlotPoints -> 50]
Horizontal Visibility Graphs for Elementary Cellular Automata
My new publication at the Wolfram Demonstration Project is Horizontal Visibility Graphs for Elementary Cellular Automata. Follow the link to view interactive version. Here is an exert from text: “A time series can be formed from an evolution of a finite elementary cellular automaton (ECA). This can be done in a few different ways. We can […]
Automating xkcd Diagrams: Transforming Serious to Funny
An article I wrote for Wolfram Blog was just released. Here is the beginning: “On early Monday morning I noticed an interesting question posted on Mathematica Stack Exchange titled quite innocently “xkcd-style graphs.” Due to the popularity of Randall Munroe’sxkcd web comic, I expected a bit more than average of about ten or so up-votes, a few bookmarks. Little did I […]
Polyhedra obtained by stellation
Stellation is the process of constructing polyhedra by extending the facial planes past the polyhedron edges of a given polyhedron until they intersect. The set of all possible polyhedron edges of the stellations can be obtained by finding all intersections on the facial planes. Since the number and variety of intersections can become unmanageable for […]
Lissajous Patterns on a Sphere Surface
Another Demonstration of mine was published at the Wolfram Demonstration Project. It helps to explore and create spherical artistic designs. I generalized Lissajous curves to spherical coordinates. Azimuthal and polar angles undergo oscillations while the radius is kept constant. Although with the parameterization given I sought to emphasize the artistic side of Lissajous patterns, other spherical parameterizations […]