To celebrate Nietzsche birthday let’s compute something relevant a bit to to the philosophy he founded, existentialism, and it’s Eastern counterpart (as some people think) – zen.
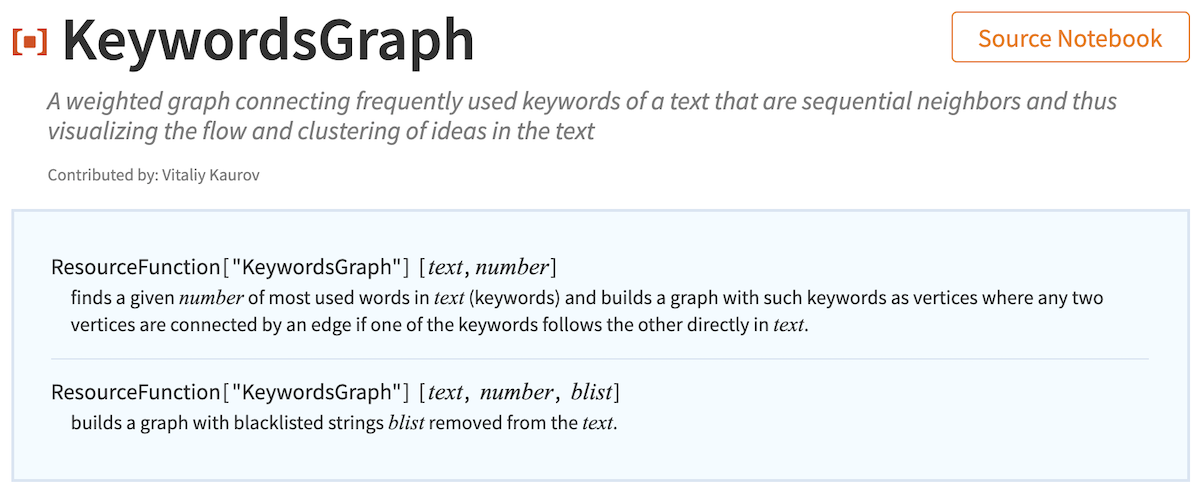
Wolfram Function Repository provides a unique opportunity for the Wolfram Language users to publish their own algorithms and immediately use them from within the Wolfram Language. I have recently published a function KeywordsGraph:
https://resources.wolframcloud.com/FunctionRepository/resources/KeywordsGraph
that can be used in the field of Computational Humanities. It generates a weighted graph connecting frequently used keywords of a text that are sequential neighbors and thus visualizing the flow and clustering of ideas in the text. It is well automated, so non-programmer humanities professional can easily use it in her research. Moreover some more sophisticated options are available for fine tuning of the algorithm. Please see the supporting docs and the source notebook for the function usage.
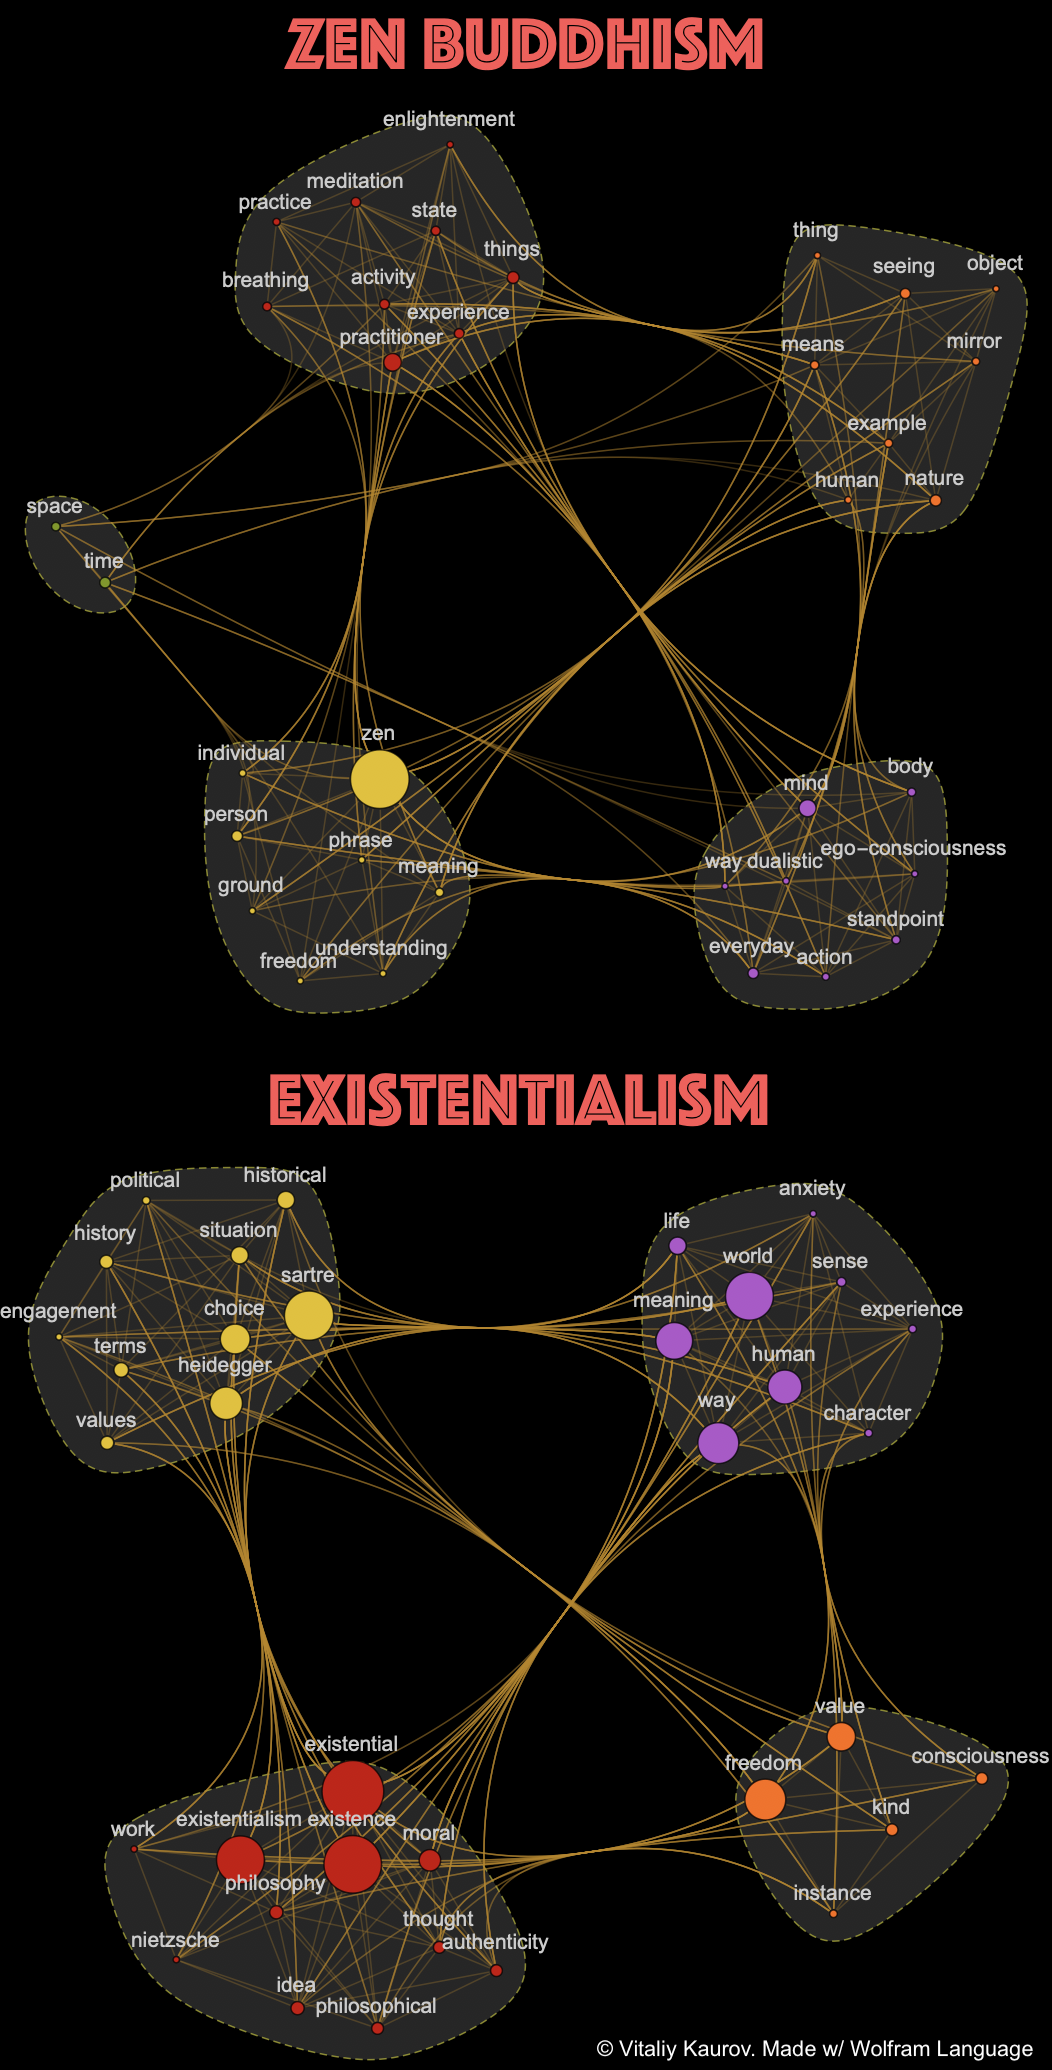
For the visualization above Stanford Encyclopedia of Philosophy articles were the original text source. We can outline some main key-points:
- VertexWeight is set for every vertex to the number of times the corresponding keyword is encountered in text. This is reflected in the VertexSize.
- EdgeWeight is set for every edge to the number of times an edge connection is made. Among other applications, this also help to build more meaningful CommunityGraphPlot as some of its methods take EdgeWeight in account.
- Modularity-based clustering is used to find graph communities with CommunityGraphPlot.
The Wolfram Language code works as follows. First we access the text of articles on Japanese Zen Buddhist Philosophy and Existentialism
    zen = Import["https://plato.stanford.edu/entries/japanese-zen"];
    existentialism = Import["https://plato.stanford.edu/entries/existentialism"];
The we define the styles for graphs:
    styles={
    VertexLabelStyle->Directive[GrayLevel[.8],14],
    EdgeStyle->Opacity[.3],
    VertexSize->"VertexWeight",
    GraphStyle->"Prototype",
    VertexLabels -> Placed[Automatic, Above],
    Background->Black};
The graphs are built as follows below. Note some text-filtering done with StringTake, because we do not need formal intro and bibliography. Also note for zen string "\[CloseCurlyQuote]s" is blacklisted.
    zen=CommunityGraphPlot[
        ResourceFunction["KeywordsGraph"][StringTake[zen,{610,87832}],35,{"\[CloseCurlyQuote]s"},styles],
    PlotLabel->Style["Zen Buddhism",50,Lighter@Red,FontFamily->"Phosphate"],
    CommunityBoundaryStyle->Directive[Yellow,Dashed,Opacity[.5]],
    CommunityRegionStyle->Directive[Gray,Opacity[.3]],ImageSize->700{1,1}]

    exi=CommunityGraphPlot[
        ResourceFunction["KeywordsGraph"][StringTake[existentialism,{592,86395}],35,{},styles],
    PlotLabel->Style["existentialism",50,Lighter@Red,FontFamily->"Phosphate"],
    CommunityBoundaryStyle->Directive[Yellow,Dashed,Opacity[.5]],
    CommunityRegionStyle->Directive[Gray,Opacity[.3]],ImageSize->700{1,1}]
Final visual is made with:
Grid[{{zen}, {exi}}, Spacings -> {0, 0}]
Essential info for citation:
DETAILs: https://wolfr.am/zen-existentialism
TOOLs: all processing, algorithms, & visualizations are in Wolfram Language: http://wolfr.am/language
DATA: Stanford Encyclopedia of Philosophy:
- Japanese Zen Buddhist Philosophy: https://plato.stanford.edu/entries/japanese-zen
Existentialism: https://plato.stanford.edu/entries/existentialism
ALGORITHM (published at Wolfram Function Repository):
https://resources.wolframcloud.com/FunctionRepository/resources/KeywordsGraphKeywordsGraph is a type of visualization I developed designated to produce a weighted graph connecting frequently used keywords of a text that are sequential neighbors and thus visualizing the flow and clustering of ideas in the text. Here modularity-based clustering is used in on the resulting KeywordsGraph to visualize which ideas are more related. The vertex size reflects on frequency corresponding term in the text. The flow of ideas can be also visualized (see the docs for algorithm).


 – The Public Domain Review")
 – The Public Domain Review")


 – The Public Domain Review")


Leave a Reply