What is common between a symphony and a novel? They both progress linearly in time. This is why songs match lyrics and music so well. This seems obvious but comprehension of spacial objects is different. You can look at a two-dimensional painting and your sense of art is driven by the simultaneous perception of different spacial regions and their properties: color, contrast, etc. The simultaneous comparison of many different parts is the very mechanism of spacial perception. In contrast an average person cannot read more than one sentence at a time. And listening to the same parts of melody simultaneously can create cacophony or at least shift from the intended by creator sound. Because our consciousness is forced to constantly move though time and not space, we perceive spacial and temporal structures differently.
We use memory to improve comprehension of temporal phenomena. But it is till quite hard to remember and compare many different moments simultaneously. Remembering the secondary sense of “relations” or “correlations” between different moments is even harder. What if we could extract important information from a temporal structure and reflect it via a spacial visual representation?
As an example let’s take US presidents inaugural addresses. They are short pieces of text that at times may seem very similar to each other. So there there are 2 levels of comparison:
- What are ideas and relations between them in a single speech?
-
What is common and different between different speeches?
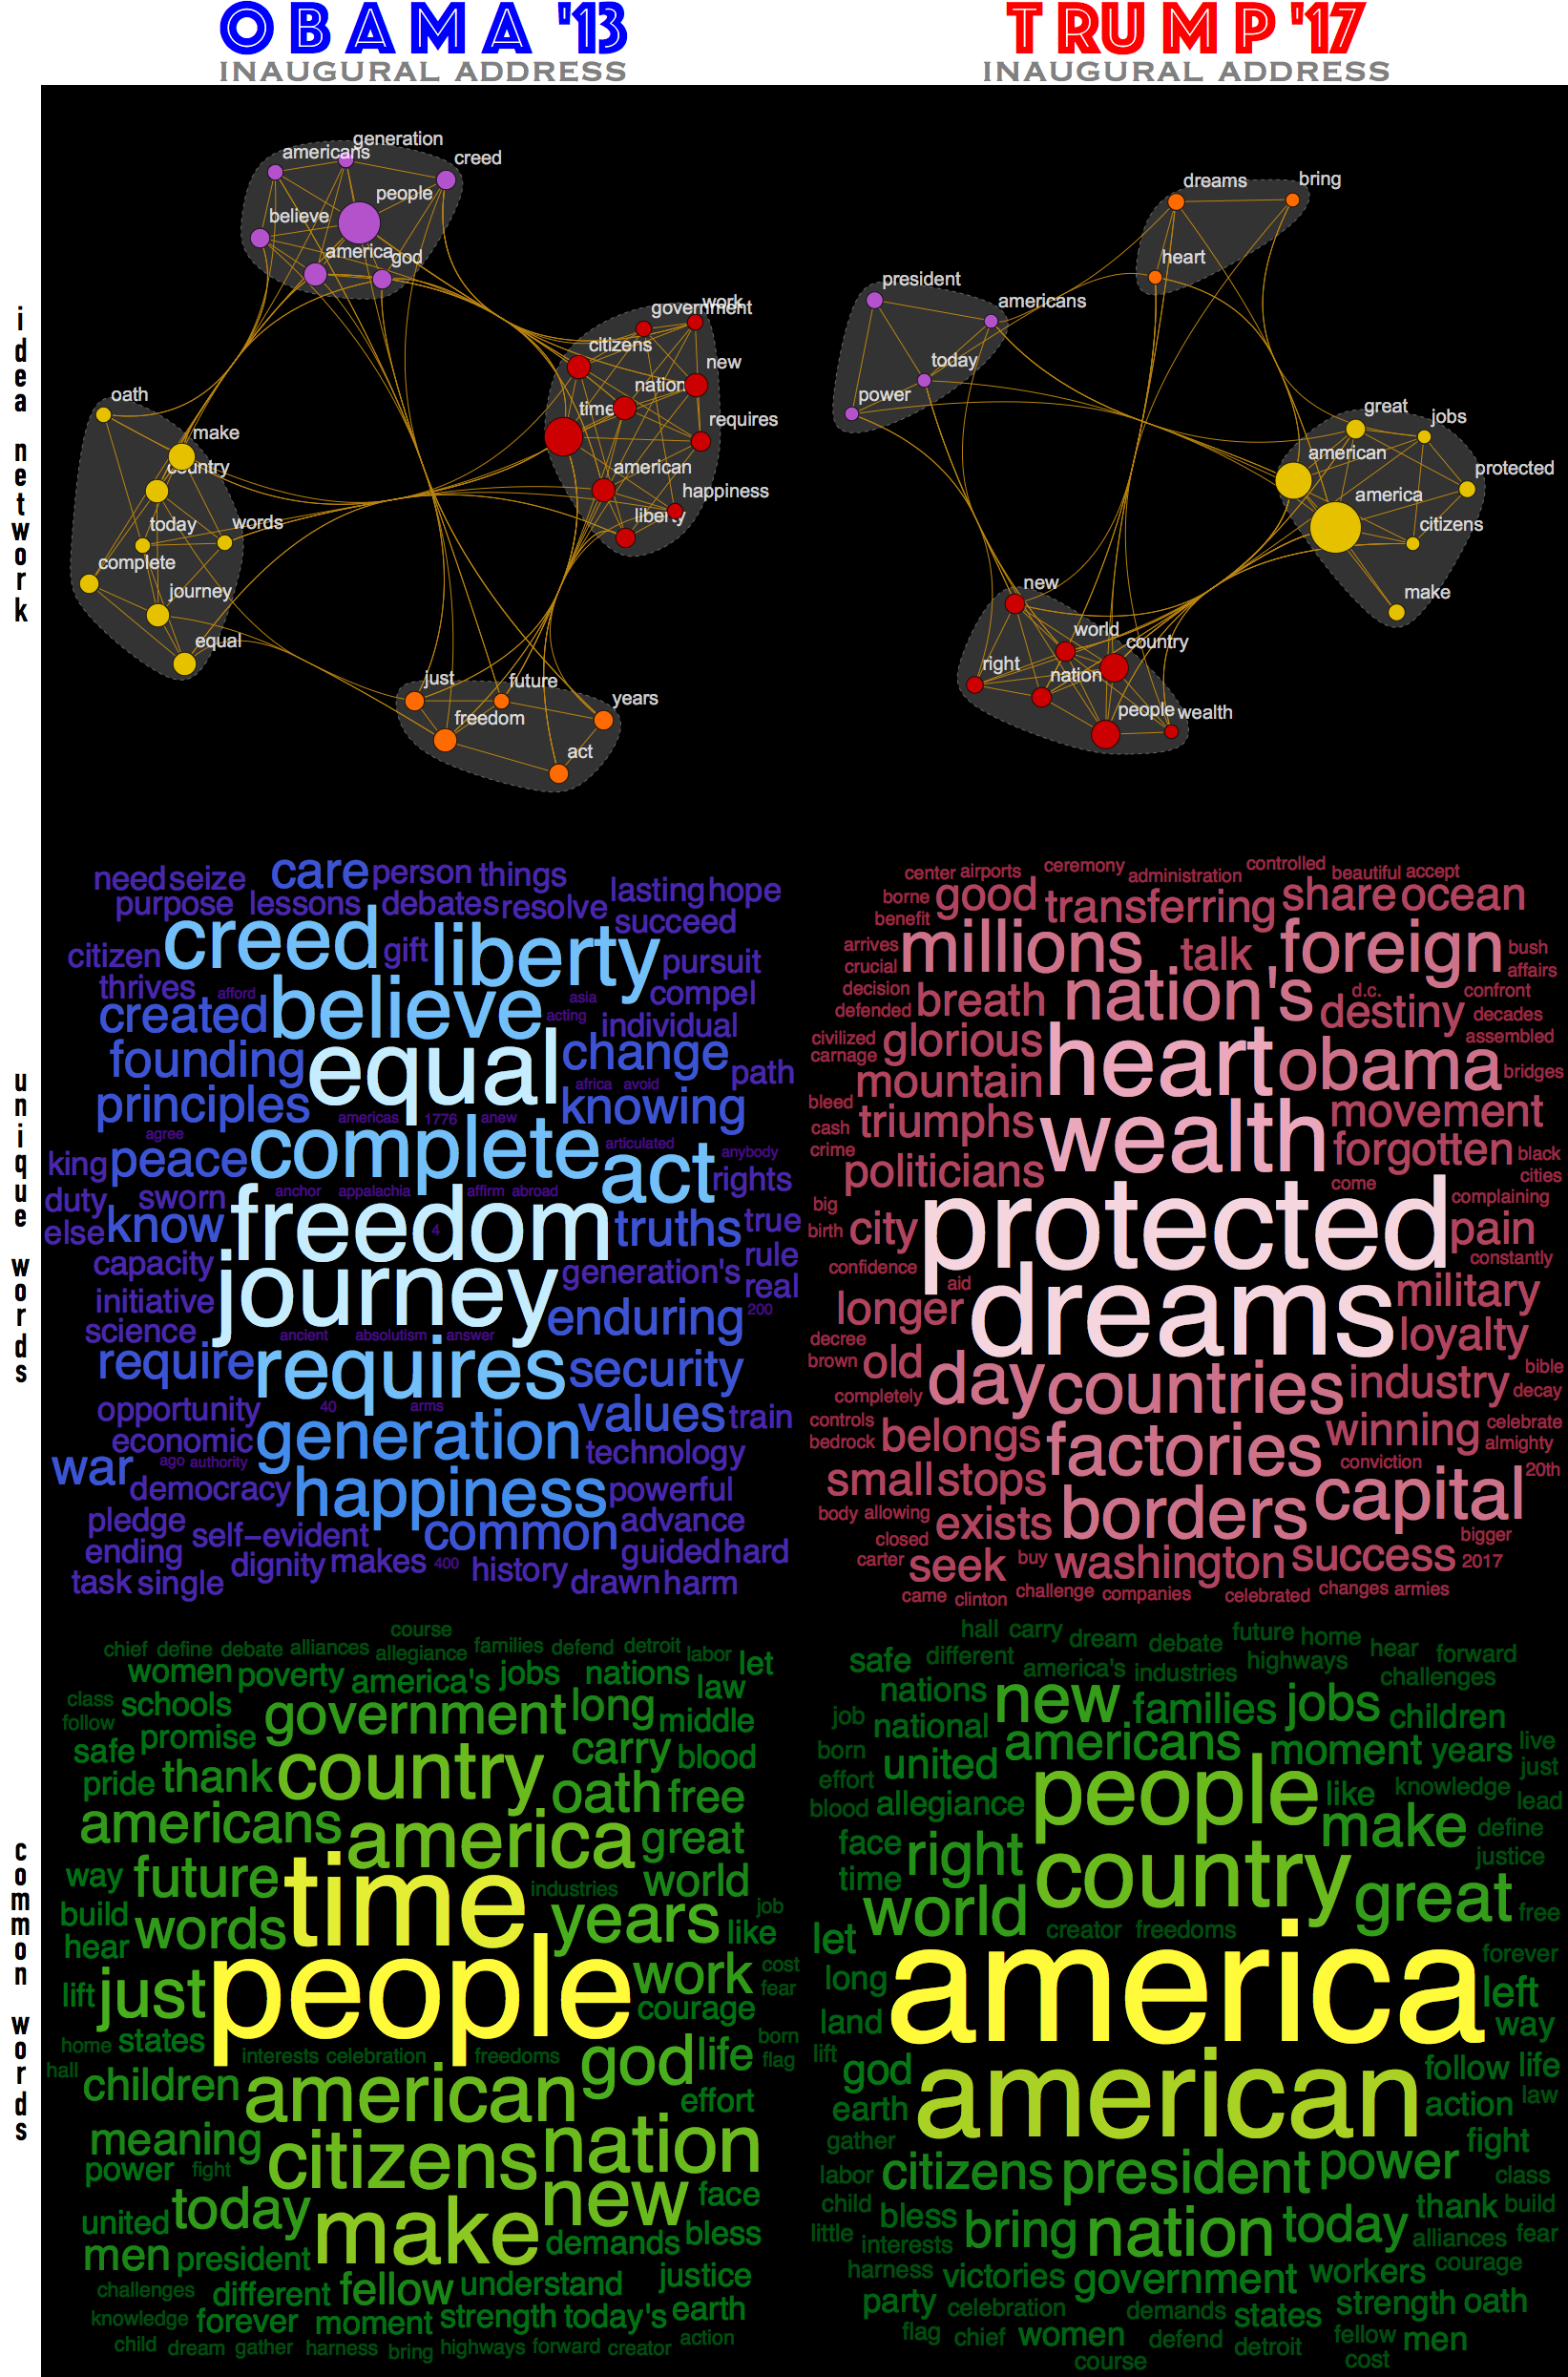
It is possible to create some very simple tools of text processing that give some immediate insight. In the image above you see a take on Obama 2013 and Trump 2017 inauguration speeches. Top idea-networks reflect the top ideas and relationships between them inside a speech. The top-terms are also clustered to indicate which ideas are in the tighter relationships. And word clouds show common and unique top words for each presidential address. Also notice, that while the common words are “common” they have different weights for each address, which redistributes the meaningful stress between common ideas.
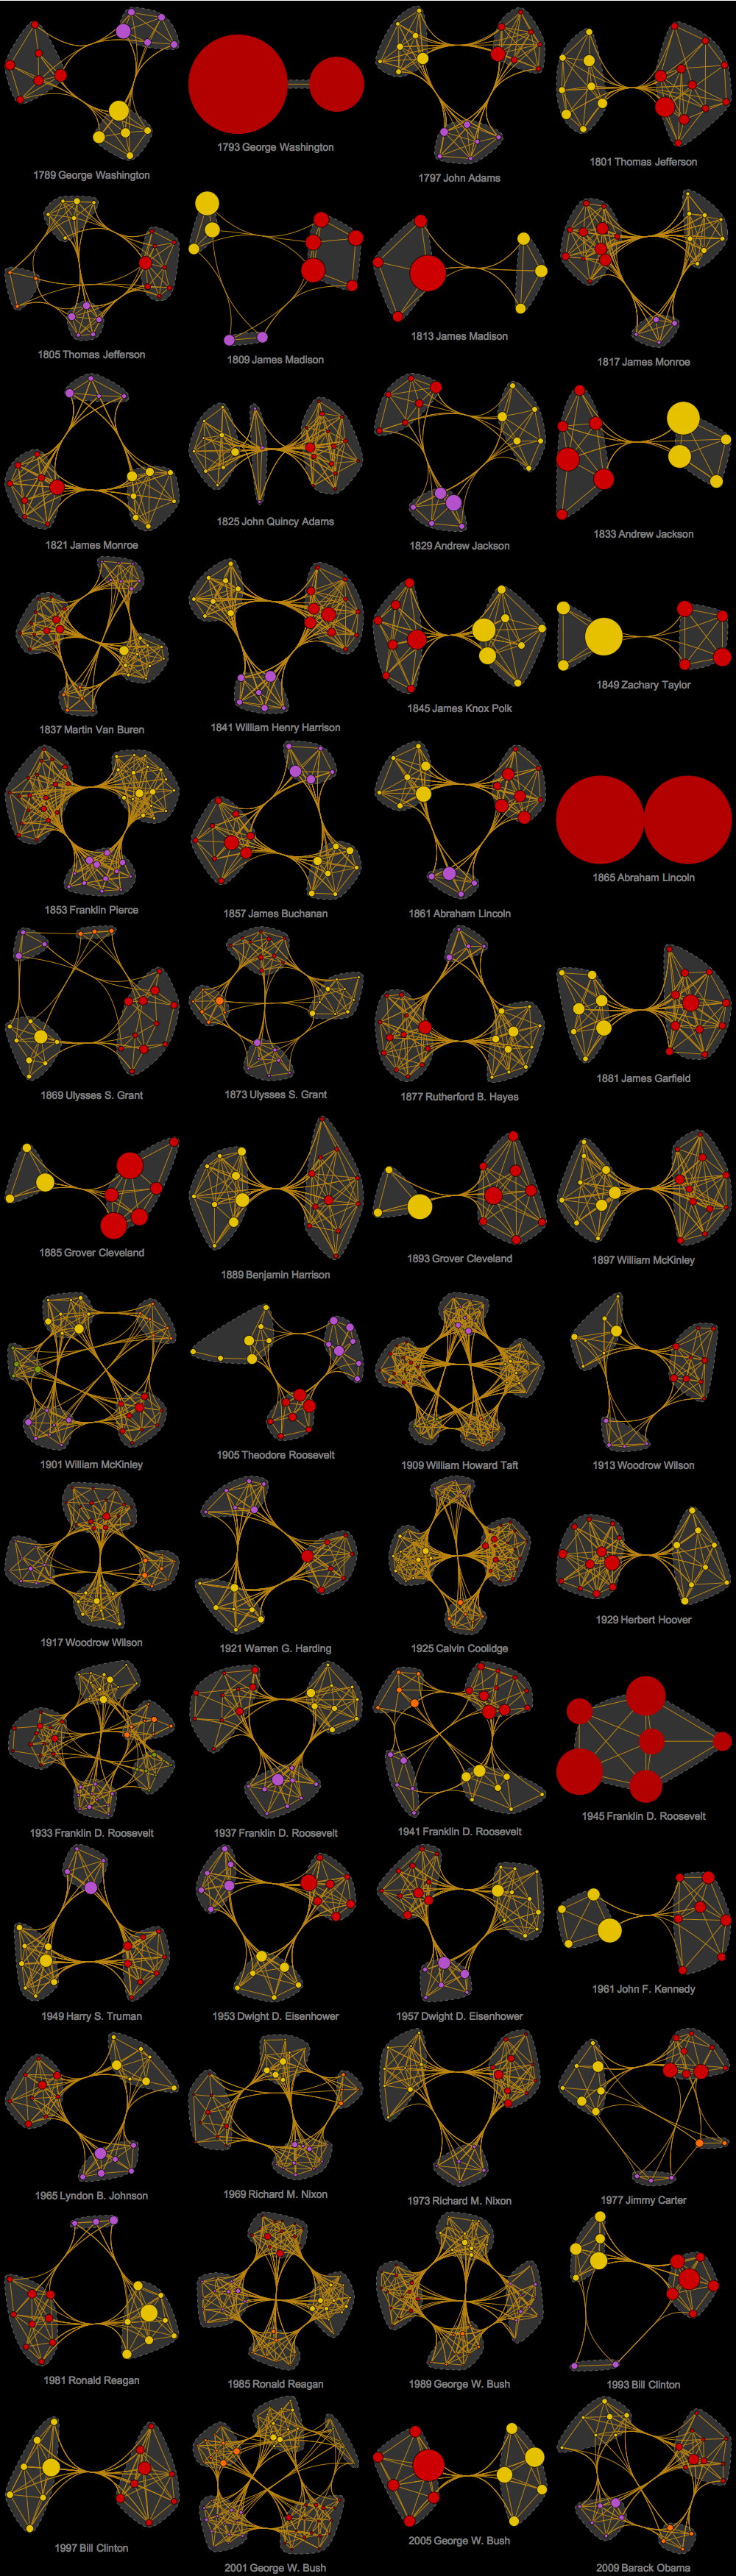
The Wolfram Language code for building these objects is below. It works in a very simple way. For word clouds you find unique and common words and then find their statistical weights. For the idea networks it is just a little bit more subtle. First you find “top terms” by deleting stop words and tallying the rest. Than you say that only tally weighting greater than a specific threshold counts as a “main idea” on which you build your network. The edges are drown between top-terms that are direct neighbors in the text. Thresholding of tally could be a bit misleading as selection of this cutoff is subjective and per-candidate specific. This means that a threshold chosen for one candidate may not work as well for the other because they may generate different statistical distribution of top-terms in the speeches. For Obama and Trump in the image above I used slightly different thresholds to get nicer visualizations. As a counterexample, below are net-ideas of inaugural addresses for the rest of 56 US presidents thresholded at the same “Obama-level”. As you can see sometimes the nets are overloaded and sometimes they are too simple. Which in itself tells something about different structures of texts and prompt us for careful treatment of the threshold.
The final code and more details are given below.
A unique feature of Wolfram Language a multitudes of built-in curated data. We can access all inauguration speeches as
allOBJ = SortBy[ResourceData["Presidential Inaugural Addresses"], "Date"];
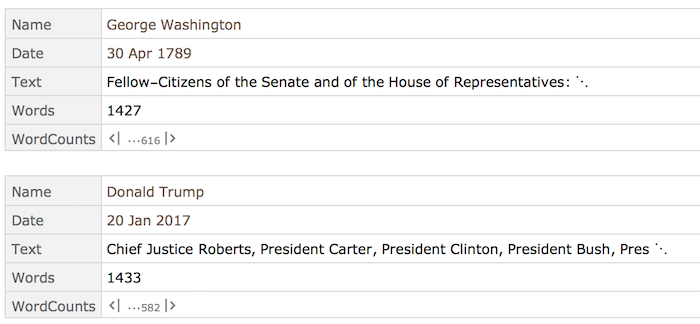
This is a sample of the dataset:
Column[allOBJ /@ {1, -1}]
Extract all texts and names and dates:
    allTEXT = Normal[allOBJ[All, "Text"]];
    allNAME = Normal[allOBJ[All, DateString[#Date, "Year"] <> " " <> CommonName[#Name] &]];
Idea-network
Idea-nets are built
    ideaNET[text_String,order_]:=
    Module[
        {wordsTOP, edges,resctal, words=TextWords[DeleteStopwords[ToLowerCase[text]]]},
        resctal=Transpose[MapAt[N[Rescale[#]]&,Transpose[Tally[words]],2]];
        wordsTOP=Select[resctal,Last[#]>=order &];
        edges=UndirectedEdge@@@DeleteDuplicates[Sort/@DeleteCases[
                Partition[Cases[words,Alternatives@@wordsTOP[[All,1]]],2,1],{x_String,x_String}]];
        CommunityGraphPlot[
            Graph[edges,
                VertexSize->Thread[wordsTOP[[All,1]]->.1+.9wordsTOP[[All,2]]],
                VertexLabels->Automatic,VertexLabelStyle->Directive[20,White,Opacity[.8]],
                GraphStyle->"Prototype",Background->Black],
        CommunityBoundaryStyle->Directive[GrayLevel[.4],Dashed],
        CommunityRegionStyle->GrayLevel[.2],
        ImageSize->800{1,1},
        PlotRangePadding->{{.1,.3},{0.1,0.1}}]
    ]
Example: JFK inaugural address:
ideaNET[allTEXT[[-15]], .17]

Unique and common top-terms
The code that makes very top graphics is:
plusCLOUD[allTEXT[[-2]], allTEXT[[-1]], "o b a m a '13", "t ru m p '17"]
With idea-nets defined as above and plusCLOUD as below:
    plusCLOUD[text1_String,text2_String,label1_String,label2_String]:=
    Module[
        {same,
        words1=TextWords[DeleteStopwords[ToLowerCase[text1]]],
        words2=TextWords[DeleteStopwords[ToLowerCase[text2]]]},
        same=Intersection[words1,words2];
        Grid[
            {{"",Column[{
                    Style[label1,80,Blue,FontFamily->"Phosphate"],
                    Style["inaugural address",45,Gray,FontFamily->"Copperplate"]
                },Alignment->Center],
                Column[{
                    Style[label2,80,Red,FontFamily->"Phosphate"],
                    Style["inaugural address",45,Gray,FontFamily->"Copperplate"]
                },Alignment->Center]},
            {Framed[Column[Style[#,35,FontFamily->"DIN Condensed"]&/@Characters["idea network"],
                Alignment->Center],FrameStyle->White,FrameMargins->10],
            ideaNET[text1,.21],ideaNET[text2,.18]},
            {Framed[Column[Style[#,35,FontFamily->"DIN Condensed"]&/@Characters["unique words"],
                Alignment->Center],FrameStyle->White,FrameMargins->10],
            WordCloud[DeleteCases[words1,Alternatives@@same],ImageSize->800{1,1},
                ColorFunction->(ColorData["DeepSeaColors"][(.2+#)/1.2]&),Background->Black],
            WordCloud[DeleteCases[words2,Alternatives@@same],ImageSize->800{1,1},
                ColorFunction->(ColorData["ValentineTones"][(.2+#)/1.2]&),Background->Black]},
            {Framed[Column[Style[#,35,FontFamily->"DIN Condensed"]&/@Characters["common words"],Alignment->Center],FrameStyle->White,FrameMargins->10],
            WordCloud[Cases[words1,Alternatives@@same],ImageSize->800{1,1},
                ColorFunction->(ColorData["AvocadoColors"][(.2+#)/1.2]&),Background->Black],
            WordCloud[Cases[words2,Alternatives@@same],ImageSize->800{1,1},
                ColorFunction->(ColorData["AvocadoColors"][(.2+#)/1.2]&),Background->Black]
            }},
        Spacings->{0, 0}]
    ]


 – The Public Domain Review")
 – The Public Domain Review")


 – The Public Domain Review")


Leave a Reply